Ontario Cap Rate Report: Q1 2026

Ontario Cap Rate Report: Q1 2026
The Ontario multifamily market continues to show resilience in Q1 2026, with cap rates holding steady despite broader economic uncertainty. Our analysis of 47 transactions totaling $312M across the province reveals distinct regional patterns and emerging opportunities.
Executive Summary
Provincial average cap rates remain compressed at 4.6%, down 15 basis points from Q4 2025. However, this headline number masks significant regional variation and asset class differentiation that savvy investors can capitalize on.
Key Findings:
Regional Analysis
Greater Toronto Area
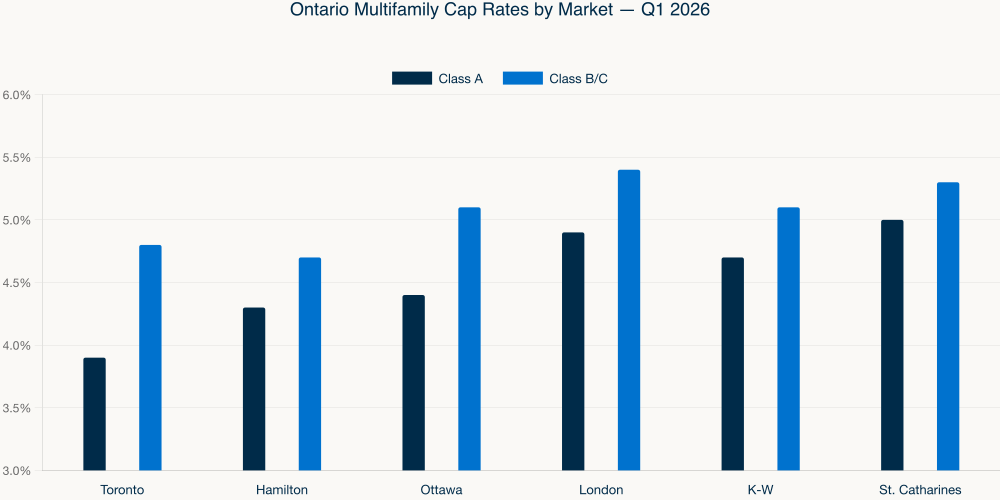
The GTA remains the most competitive market, with institutional capital driving cap rate compression. Class A assets in prime locations (Yonge corridor, waterfront) are trading at 3.8-4.0%, while suburban Class B properties are finding buyers at 4.5-4.8%.
Notable transactions include a 142-unit complex in North York that closed at 4.1%, reflecting strong fundamentals: 96% occupancy, in-place rents 12% below market, and proximity to transit.
Investment Thesis: Focus on value-add opportunities in Class B assets with below-market rents. The spread between in-place and market rents creates immediate upside potential.
Hamilton-Burlington Corridor
Hamilton has emerged as a clear beneficiary of Toronto spillover demand. The combination of GO Train accessibility and relative affordability continues to attract both residents and investors.
Cap rates for quality assets have compressed to 4.2-4.6%, but we're seeing opportunities in the 4.6-4.8% range for well-located properties requiring modest capital improvements.
Market Driver: Industrial growth along the QEW corridor is creating employment density and rental demand. Properties within 2km of GO stations command premium pricing.
Ottawa Region
The federal government's return-to-office mandate has stabilized Ottawa fundamentals after pandemic uncertainty. However, the market shows clear east-west and urban-suburban divisions.
Downtown core assets are trading at 4.4-4.8%, while properties in growth suburbs like Kanata and Orleans are finding buyers at 5.0-5.2%.
Opportunity: The suburban spread creates value opportunities for investors willing to hold through the office normalization cycle.
London Market
London represents our strongest conviction opportunity. The market offers superior yield (4.8-5.5% cap rates) while maintaining solid fundamentals: Western University enrollment stability, healthcare sector employment, and reasonable supply constraints.
Investment Thesis: Secondary markets with educational and healthcare anchors offer defensive characteristics with yield premiums. London checks both boxes.
Kitchener-Waterloo Tech Hub
The "Canadian Silicon Valley" continues to attract technology talent, supporting rental demand despite tech sector volatility. Cap rates of 4.6-5.2% reflect this underlying strength.
Recent transactions show institutional buyers paying sub-5% cap rates for assets near the universities and technology corridor.
Market Drivers and Outlook
Supply Constraints
New multifamily supply remains constrained by municipal approval processes, construction costs, and financing availability. This supply-demand imbalance supports current valuations.
Immigration and Demographics
Federal immigration targets of 500,000 new residents annually continue to drive underlying rental demand, particularly in urban centers.
Interest Rate Environment
Current Bank of Canada policy supports cap rate compression, though rising construction costs create natural ceiling effects on new supply.
Investment Recommendations
Methodology
This analysis incorporates proprietary transaction data from our brokerage activities, public records, and confidential market intelligence from lender relationships. Cap rates calculated using trailing 12-month NOI and confirmed sale prices.
Dayma Itamunoala is Vice President and Team Leader of Colliers Ontario Multifamily Investment Sales. His team has completed over $1.12B in multifamily transactions since 2018.
Get analysis like this delivered every week.
Join 14,000+ multifamily professionals staying ahead of Ontario market trends.